
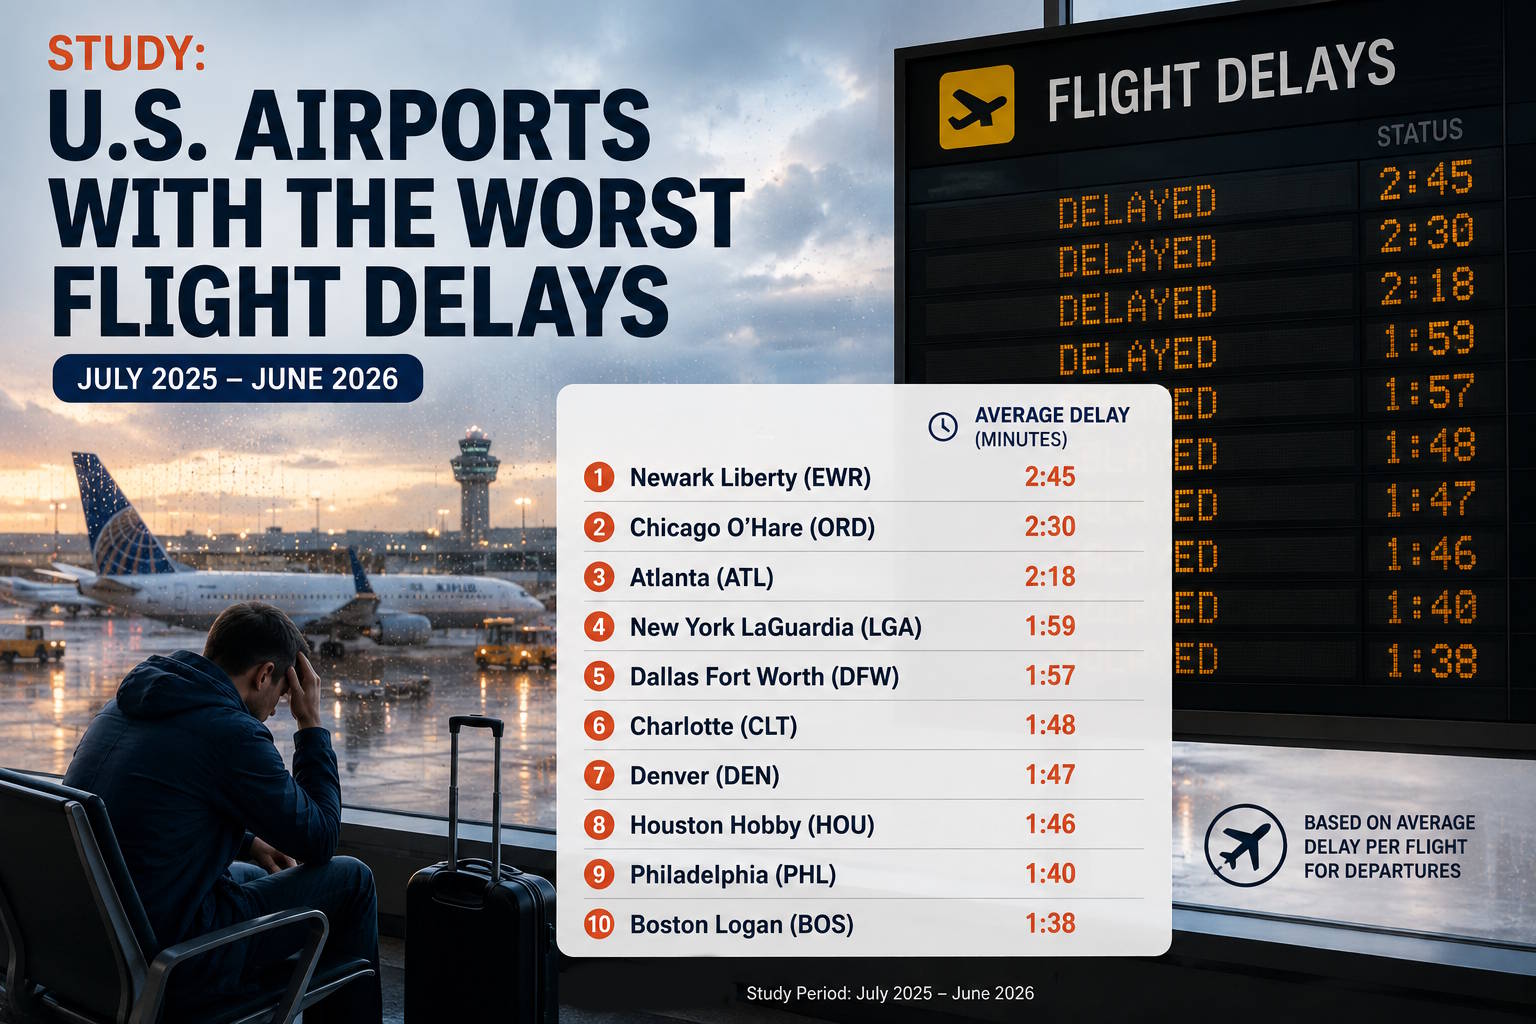
Study: U.S. Airports with the Worst Flight Delays
An analysis of 7.78 million domestic flights across 368 U.S. airports — July 2025 to June 2026
If you’ve ever sat at a gate watching the departure board flip from “On Time” to “Delayed” — again — you’re not alone. Between July 2025 and June 2026, more than 1.6 million domestic U.S. flights arrived late, and over 144,000 were cancelled outright.
At TheSudoku.com, we know a thing or two about killing time while waiting. A quick sudoku puzzle on your phone can make an unexpected airport layover bearable — but only if you know which airports are most likely to put you in that situation. So we dug into the U.S. Bureau of Transportation Statistics database, analyzing a full year of flight data, to find out which airports are the worst offenders for delays and cancellations.
Key Takeaways
- Dallas Love Field (DAL) has the worst departure delay rate in America: nearly 30% of flights leave late.
- Sanford, FL (SFB) leads the nation in arrival delays, with 29.5% of flights arriving more than 15 minutes behind schedule.
- Aspen, CO (ASE) cancels more flights than any other U.S. airport — 6.3% of departures never leave the ground.
- GoJet Airlines (G7) is the most delay-prone carrier, with 28.9% of arrivals running late.
- Late aircraft is the single biggest cause of delay nationwide, accounting for over 50 million minutes of lost time in one year.
- Pasco, WA (PSC) is the most punctual airport — only 11.6% of departures run late.
- July is the worst month to fly, with 27.9% of arrivals delayed; September is the best, at just 15.7%.
The Worst Airports for Departure Delays
We ranked 368 U.S. airports by the percentage of departing flights that left more than 15 minutes behind schedule. Only airports with at least 5,000 flights over the 12-month period were included, to ensure statistical significance.
| # | Code | City | Flights | Delay % | Trend | Avg. Delay |
|---|---|---|---|---|---|---|
| 1 | DAL | Dallas, TX | 69,398 | 29.9% | 18.2 min | |
| 2 | ASE | Aspen, CO | 7,471 | 28.9% | 32.1 min | |
| 3 | FLL | Fort Lauderdale, FL | 87,892 | 28.4% | 21.8 min | |
| 4 | DFW | Dallas/Fort Worth, TX | 303,028 | 28.1% | 22.1 min | |
| 5 | SFB | Sanford, FL | 10,067 | 27.2% | 24.9 min | |
| 6 | MDW | Chicago, IL | 73,655 | 26.6% | 16.8 min | |
| 7 | ORD | Chicago, IL | 372,103 | 26.5% | 23.2 min | |
| 8 | BNA | Nashville, TN | 109,992 | 26.1% | 18.0 min | |
| 9 | BWI | Baltimore, MD | 93,161 | 25.9% | 17.1 min | |
| 10 | DCA | Washington, DC | 141,654 | 25.7% | 21.6 min |
Dallas dominates the top of the list. Love Field (DAL) takes the crown with nearly 30% of departures running late, while its larger neighbor DFW — handling over 300,000 flights in the year — posts a 28.1% delay rate. Together, the two Dallas airports process more than 370,000 departures, and more than one in four leaves behind schedule.
Florida is another delay hotspot, with Fort Lauderdale, Sanford, and West Palm Beach all in the top 15. Chicago’s both major airports — O’Hare and Midway — make the top 10, with O’Hare processing a staggering 372,103 flights while delaying 26.5% of them.
Aspen (ASE) is a notable outlier: a small seasonal airport with only 7,471 flights, but nearly 29% depart late with an average delay of 32 minutes — the longest average delay on the list.
The Worst Airports for Arrival Delays
Departure delays are frustrating, but arrival delays are what make you miss connections, dinners, and meetings. We ranked airports by the percentage of arriving flights more than 15 minutes behind schedule.
| # | Code | City | Flights | Delay % | Trend | Avg. Delay |
|---|---|---|---|---|---|---|
| 1 | SFB | Sanford, FL | 10,067 | 29.5% | 26.6 min | |
| 2 | ASE | Aspen, CO | 7,471 | 28.8% | 32.0 min | |
| 3 | TVC | Traverse City, MI | 6,506 | 28.7% | 29.6 min | |
| 4 | ORD | Chicago, IL | 372,103 | 28.5% | 24.2 min | |
| 5 | FLL | Fort Lauderdale, FL | 87,892 | 27.8% | 21.7 min | |
| 6 | DFW | Dallas/Fort Worth, TX | 303,028 | 27.3% | 21.7 min | |
| 7 | SBN | South Bend, IN | 8,128 | 27.2% | 29.2 min | |
| 8 | DCA | Washington, DC | 141,654 | 26.2% | 21.9 min | |
| 9 | PIA | Peoria, IL | 5,930 | 26.0% | 25.8 min | |
| 10 | LGA | New York, NY | 158,679 | 25.9% | 21.2 min |
Chicago O’Hare stands out here: among airports with over 100,000 flights, it has the worst arrival delay rate at 28.5%. When you’re handling 372,000 flights a year, that means over 106,000 late arrivals.
Seasonal and regional airports — Sanford, Aspen, Traverse City, South Bend, and Peoria — cluster at the top, suggesting that smaller airports with concentrated leisure traffic are particularly vulnerable to delays. Traverse City, a popular Michigan vacation destination, delays nearly 29% of arrivals with an average lateness of nearly 30 minutes.
The Highest Flight Cancellation Rates
Sometimes a delay isn’t a delay — it’s a cancellation. We looked at which airports scrub the highest percentage of their scheduled flights.
| # | Code | City | Cancellation % | Trend | Total Flights |
|---|---|---|---|---|---|
| 1 | ASE | Aspen, CO | 6.3% | 7,471 | |
| 2 | LGA | New York, NY | 4.8% | 158,679 | |
| 3 | DCA | Washington, DC | 3.7% | 141,654 | |
| 4 | BGR | Bangor, ME | 3.6% | 6,080 | |
| 5 | TVC | Traverse City, MI | 3.6% | 6,506 | |
| 6 | JFK | New York, NY | 3.4% | 120,505 | |
| 7 | BTV | Burlington, VT | 3.4% | 9,103 | |
| 8 | ILM | Wilmington, NC | 3.3% | 10,840 | |
| 9 | PIA | Peoria, IL | 3.2% | 5,930 | |
| 10 | EWR | Newark, NJ | 3.2% | 131,336 |
Aspen leads the nation in cancellations at 6.3%, reflecting the challenges of operating a seasonal mountain airport where weather and demand fluctuate dramatically.
But the more telling story is in the major hubs: New York’s three airports — LaGuardia (4.8%), JFK (3.4%), and Newark (3.2%) — all make the top 10. The New York metro area is the cancellation capital of American aviation. Washington Reagan (DCA) joins them at 3.7%, making the Northeast Corridor the toughest region in the country for flight reliability.
What Causes Flight Delays?
The BTS classifies delay causes into five categories. Here’s how they stacked up in total delay minutes across all U.S. flights over the 12-month period:
| Delay Cause | Total Minutes | Share | Visual |
|---|---|---|---|
| Late Aircraft Delay | 50,375,482 | 38.7% | |
| Carrier Delay | 40,734,538 | 31.3% | |
| NAS (Air System) Delay | 25,589,703 | 19.7% | |
| Weather Delay | 7,723,665 | 5.9% | |
| Security Delay | 163,473 | 0.1% |
Late aircraft is the #1 cause by a wide margin — over 50 million minutes of delay in a single year. When an incoming flight is late, the outbound flight inherits the delay. This cascading effect means a single morning delay at one airport can ripple through the network for the entire day, and even into the next.
Carrier delays (maintenance, crew, fueling, boarding) account for another 40 million minutes — suggesting that airline operations themselves, not just weather or air traffic, are a massive source of lost time.
Weather, despite being the most commonly cited excuse, accounts for fewer than 8 million minutes — roughly 6% of the total. Security delays are virtually negligible at 163,473 minutes nationwide.
The Most Delay-Prone Airlines
We ranked airlines by the percentage of their arrivals that were more than 15 minutes late. Only carriers with at least 10,000 flights were included.
| # | Airline | Flights | Delay % | Trend | Avg. Delay |
|---|---|---|---|---|---|
| 1 | G7 (GoJet) | 81,269 | 28.9% | 31.3 min | |
| 2 | B6 (JetBlue) | 227,675 | 26.6% | 21.6 min | |
| 3 | NK (Spirit) | 129,223 | 26.3% | 21.1 min | |
| 4 | F9 (Frontier) | 201,159 | 26.1% | 23.3 min | |
| 5 | G4 (Allegiant) | 125,937 | 25.3% | 23.7 min | |
| 6 | AA (American) | 960,185 | 24.9% | 22.8 min | |
| 7 | OH (PSA Airlines) | 230,771 | 24.8% | 24.7 min | |
| 8 | WN (Southwest) | 1,374,942 | 22.6% | 13.8 min | |
| 9 | 9E (Endeavor) | 242,145 | 21.7% | 19.1 min | |
| 10 | YX (Republic) | 346,288 | 21.0% | 16.4 min |
GoJet Airlines, a regional carrier operating United Express flights, takes the top spot with 28.9% of arrivals running late and an average delay of over 31 minutes — the longest on the list.
The budget carriers — JetBlue, Spirit, Frontier, and Allegiant — cluster in positions 2–5, all with delay rates above 25%. American Airlines, despite operating nearly a million flights, posts a 24.9% delay rate.
Southwest Airlines deserves a mention: it operates the most flights of any carrier in our dataset (1.37 million) and has a 22.6% delay rate, but its average delay is only 13.8 minutes — the shortest among the top 10. When Southwest flights are late, they’re late by less.
The Best Airports for On-Time Departures
Not all airports are delay traps. If you want to leave on time, head to the Pacific Northwest, Hawaii, or rural Alaska.
| # | Code | City | Delay % | Trend | Avg. Delay |
|---|---|---|---|---|---|
| 1 | PSC | Pasco/Kennewick/Richland, WA | 11.6% | 11.5 min | |
| 2 | BIL | Billings, MT | 12.4% | 11.8 min | |
| 3 | KOA | Kona, HI | 12.8% | 8.9 min | |
| 4 | ITO | Hilo, HI | 13.0% | 7.5 min | |
| 5 | LIH | Lihue, HI | 13.6% | 9.0 min | |
| 6 | MFR | Medford, OR | 13.7% | 11.7 min | |
| 7 | FAI | Fairbanks, AK | 14.0% | 10.9 min | |
| 8 | OGG | Kahului, HI | 14.6% | 10.1 min | |
| 9 | MAF | Midland/Odessa, TX | 14.6% | 14.1 min | |
| 10 | AMA | Amarillo, TX | 14.6% | 14.0 min |
Pasco, Washington — serving the Tri-Cities region in eastern Washington — is the most punctual airport in America, with only 11.6% of departures running late. Hawaii’s airports continue to perform well, with Kona, Hilo, Lihue, and Kahului all in the top 10, benefiting from mild weather and lighter air traffic.
Hilo deserves special mention: when its flights are delayed, the average delay is just 7.5 minutes — barely over the 15-minute threshold that defines a “delay” in the first place.
When to Fly: Monthly Delay Trends
We tracked the percentage of delayed arrivals by month to find the best and worst times to fly.
| Month | Flights | Delay % | Trend |
|---|---|---|---|
| Jul 2025 | 674,741 | 27.9% | |
| Aug 2025 | 657,060 | 21.5% | |
| Sep 2025 | 617,170 | 15.7% | |
| Oct 2025 | 663,467 | 19.3% | |
| Nov 2025 | 612,629 | 19.8% | |
| Dec 2025 | 632,870 | 26.1% | |
| Jan 2026 | 572,599 | 20.1% | |
| Feb 2026 | 554,297 | 18.8% | |
| Mar 2026 | 653,299 | 23.5% | |
| Apr 2026 | 653,335 | 19.3% | |
| May 2026 | 668,919 | 20.6% | |
| Jun 2026 | 657,766 | 24.6% |
July is the worst month to fly, with 27.9% of arrivals delayed — peak summer travel combined with afternoon thunderstorms creates a perfect storm for delays. December follows close behind at 26.1%, as winter weather and holiday crowds collide.
September is the sweet spot: only 15.7% of arrivals are delayed, the lowest of any month. Summer travel has ended, winter weather hasn’t arrived, and airlines have recovered from the July rush. If you have flexibility in your travel schedule, September is the month to book.
Survive Your Next Delay with Sudoku
Whether you’re stuck in Dallas watching 30% of flights leave late, or you’re one of the lucky ones passing through Pasco with an 88% on-time rate, travel involves waiting. And waiting is better with a puzzle.
A game of sudoku engages your mind fully — there’s no room to dwell on the departure board when you’re tracking naked singles and hidden pairs across a 9×9 grid.
Next time your flight gets delayed, pull out your phone and fill a grid instead of refreshing the airline app. The puzzle will end before you know it — and maybe, just maybe, your flight will too.
Methodology
This study is based on the U.S. Bureau of Transportation Statistics (BTS) On-Time Performance database, specifically the Marketing Carrier On-Time Performance data covering July 2025 through June 2026.
We analyzed 7,784,304 domestic flight records across 368 U.S. airports and 20 airlines. A flight is considered “delayed” if it departs or arrives more than 15 minutes after its scheduled time, following the standard BTS definition.
For airport rankings, we included only airports with at least 5,000 flights over the 12-month period to ensure statistical reliability. Cancellation rates were calculated as the number of cancelled flights divided by the total number of scheduled flights. Delay cause breakdowns reflect the BTS-assigned categories (Carrier, Weather, National Aviation System, Security, and Late Aircraft) as reported by the operating airlines.
All data is publicly available at transtats.bts.gov and can be independently verified.
Data source: U.S. Bureau of Transportation Statistics, Airline Service Quality Performance 234, July 2025 – June 2026. Analysis by TheSudoku.com.
Leave a Reply